Brand recall
86%
Remembered Toyota / RAV4 without prompting
More than 8 in 10 viewers correctly connected the content to Toyota/RAV4. Competitor confusion was just 4%.
The brand came through
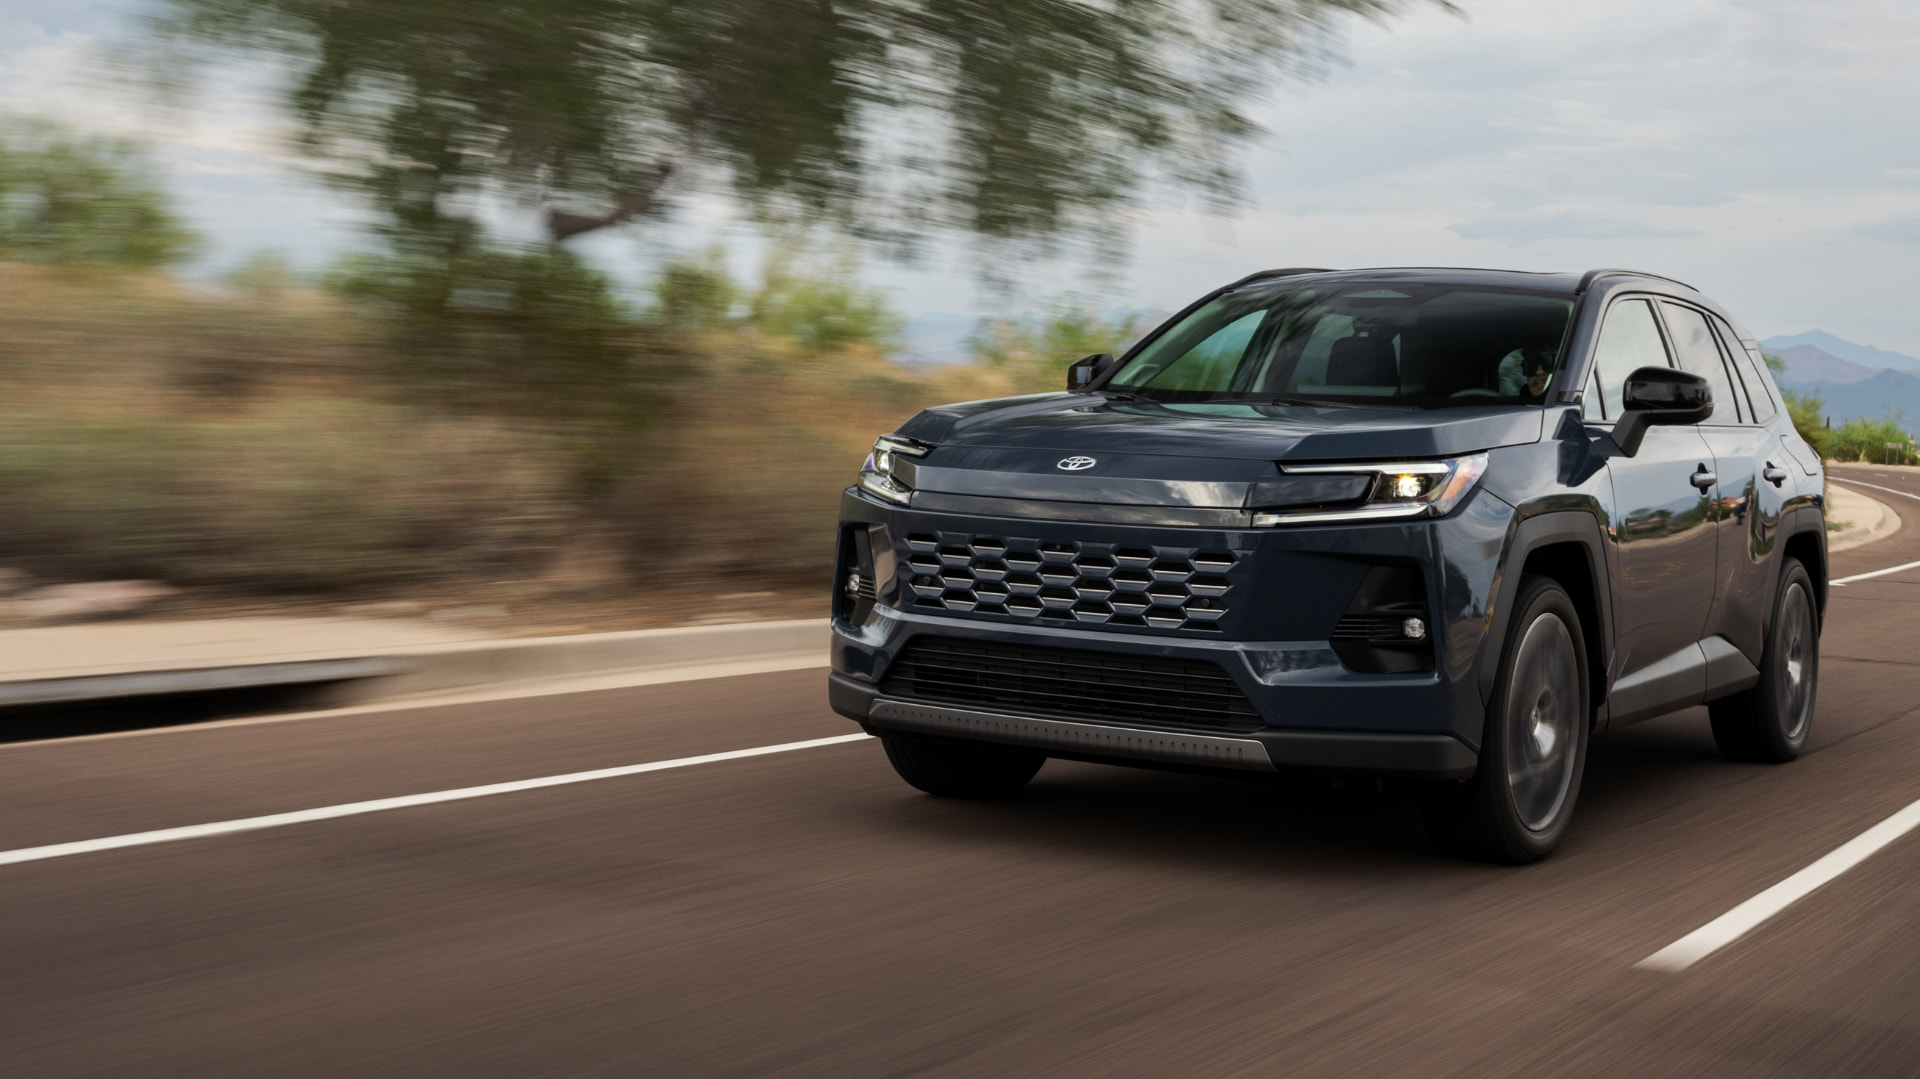
01 — The problem · Brand Lift Study, August 2026
Conill identified the central brand tension: RAV4 was respected for capability, but lacked the emotional energy to feel distinctive. Three Autoproyecto stories tested whether “Seriously Fun” could change that perception — and which expression of the strategy worked hardest.
The strategic question
Could branded content add emotion to a brand already known for rational strength?
n=1,500
national sample
3
creatives, 3 segments
6
vehicles benchmarked
95%
confidence threshold
02 — The strategy · From attribution to desire
The content first had to belong unmistakably to Toyota, then change how RAV4 felt, then move that new perception toward shopping.
Brand recall
86%
More than 8 in 10 viewers correctly connected the content to Toyota/RAV4. Competitor confusion was just 4%.
The brand came through
Serious fun
76%
The next section shows whether that reaction translated into measurable changes in RAV4 brand image.
The perception shifted
Shopping intent
69%
67% would consider RAV4 for their next vehicle and 60% were likely to visit or contact a Toyota dealer.
The effect moved down-funnel
Stated likelihood and intention measures from the survey — not observed website or dealership visits.
03 — The proof · The question the campaign needed to answer
The strongest creative did more than entertain. It significantly moved the emotional attributes at the heart of the brief: lifestyle fit, recreation, exploration, fun and driving excitement.
The problem
RAV4 already had rational strength. The opportunity was to add an emotional reason to want it.
RFP diagnosis
What the winning creative added
GR Sport / Explorer · Significant
Lifestyle fit
+15 pts
Fits the way I want to live
GR Sport / Explorer · Significant
Recreational fit
+14 pts
Made for recreational activities
GR Sport / Explorer · Significant
Experiences
+13 pts
Makes experiences more fun
GR Sport / Explorer · Significant
Exploration
+13 pts
Encourages me to seek out unique experiences
GR Sport / Explorer · Significant
Driving excitement
+12 pts
Is fun to drive
GR Sport / Explorer · Significant
Campaign idea
+11 pts
Fits the idea of Serious Fun
GR Sport / Explorer · Significant
The proof
“Seriously Fun” was not simply recognized as a campaign idea. Consumers began describing the RAV4 in the language of the strategy.
| Adventurer | Enthusiast | Explorer | |||||||
|---|---|---|---|---|---|---|---|---|---|
| Test | Ctrl | Diff | Test | Ctrl | Diff | Test | Ctrl | Diff | |
| Is fun to drive | 74% | 67% | +7 pts | 58% | 60% | -2 pts | 70% | 58% | +12 pts* |
| Makes experiences more fun | 73% | 66% | +7 pts | 61% | 61% | 0 | 72% | 59% | +13 pts* |
| Encourages me to seek out unique experiences | 72% | 64% | +8 pts | 57% | 56% | +1 pts | 66% | 53% | +13 pts* |
| Encourages me to get out and do more | 77% | 65% | +12 pts* | 60% | 58% | +2 pts | 67% | 57% | +10 pts* |
| Is made for recreational activities | 78% | 69% | +9 pts* | 68% | 69% | -1 pts | 75% | 61% | +14 pts* |
| Fits the way I want to live | 70% | 63% | +7 pts | 65% | 58% | +7 pts | 70% | 55% | +15 pts* |
| Fits the idea of Serious Fun | 70% | 62% | +8 pts | 60% | 53% | +7 pts | 67% | 56% | +11 pts* |
| Makes everyday activities feel more exciting | 72% | 64% | +8 pts | 63% | 59% | +4 pts | 67% | 54% | +13 pts* |
| Fits my lifestyle | 72% | 69% | +3 pts | 64% | 64% | 0 | 70% | 58% | +12 pts* |
| Right for people who like to explore and try new things | 76% | 68% | +8 pts | 66% | 66% | 0 | 74% | 62% | +12 pts* |
Q7. How well do each of the following describe the Toyota RAV4? Top 2 Box. Adventurers show the highest absolute levels; Enthusiasts are mostly flat apart from directional lifts on “Serious Fun” and “fits the way I want to live.”
05 — The learning · What the three stories taught us
All three stories significantly increased RAV4 vehicle choice. The more important learning is that the research isolated which emotional territory created the broadest full-funnel effect.
These films originally ran on Autoproyecto as sponsored editorial features. Each card below links to the live published content.
Adventure & outdoors
Connected RAV4 Woodland with an active, outdoor lifestyle.
+21 pts
Vehicle choice
▲ Statistically significant
Learning
A clear outdoor lifestyle story strengthened emotion and preference.
Lifestyle & everyday experiences
Positioned RAV4 Limited around everyday experiences and versatility.
+15 pts
Vehicle choice
▲ Statistically significant
Learning
Everyday versatility moved choice, but created less emotional differentiation.
Performance & excitement
Connected GR Sport with performance, style and excitement.
+25 pts
Vehicle choice
▲ Statistically significant
Significant lift across every headline KPI and all ten RAV4 brand-image statements.
Learning
Performance + excitement was the most complete expression of “Seriously Fun,” producing significant lift across every headline KPI and all ten RAV4 brand-image statements.
What the research revealed
Among the three creative/audience pairings, GR Sport / Explorer was the only one to produce statistically significant lift across familiarity, favorability, consideration and vehicle choice — while also moving every RAV4 brand-image statement tested.
Brand perception
All 10
Including Serious Fun, driving excitement, recreation, exploration and lifestyle fit.
Consideration
+12 pts
GR Sport / Explorer · Statistically significant
Vehicle choice
+25 pts
GR Sport / Explorer · Statistically significant
What this gives the agency
The strongest response appeared when “Seriously Fun” was expressed through performance, excitement and exploration. That gives the next creative brief a clearer territory to build on and test further.
GR Sport / Explorer pairing, test vs. control. The study identifies the strongest observed pairing; it does not independently isolate creative effect from audience effect.
All three vehicle-choice lifts were statistically significant.
04 — The effect · From perception to action
The perception shift was not isolated to brand image. After exposure, majorities said they were likely to research, compare, visit Toyota.com, consider RAV4 and contact a dealer.
The strategy traveled down-funnel
73%
Strongest in the Adventurer segment
73%
Strongest in the Explorer segment
69%
Strongest in the Explorer segment
67%
Strongest in the Explorer segment
60%
Strongest in the Adventurer segment
56%
Strongest in the Adventurer segment
| Adventurer | Enthusiast | Explorer | Total | |
|---|---|---|---|---|
| Search for more information about the Toyota RAV4 | 75% | 69% | 74% | 73% |
| Compare the Toyota RAV4 to other SUVs | 72% | 71% | 75% | 73% |
| Visit Toyota.com to learn more about the RAV4 | 69% | 66% | 72% | 69% |
| Consider the Toyota RAV4 for my next vehicle purchase or lease | 66% | 65% | 71% | 67% |
| Visit or contact a Toyota dealer | 62% | 55% | 62% | 60% |
| Schedule a test drive | 60% | 55% | 54% | 56% |
Q3. Based on the video you viewed, how likely are you to take each of the following actions? Top 2 Box (very + somewhat likely). Base: Test respondents (n=750). These are stated likelihood measures, not observed visits. All six actions are shown above.
Detailed findings · Q1
85–86% correctly identified Toyota/RAV4 across all three audiences, with competitor confusion at just 3–4%.
| Adventurer | Enthusiast | Explorer | |
|---|---|---|---|
| Toyota / RAV4 / stim — NET | 85% | 86% | 86% |
| Toyota RAV4 / RAV4 named | 58% | 61% | 54% |
| Toyota (brand only, no model) | 28% | 25% | 32% |
| Other brand (competitor confusion) | 4% | 3% | 4% |
| Unclear / don't know / no answer | 11% | 11% | 10% |
15%
“Woodland” named
Adventurer
14%
“GR / GR Sport” named
Explorer
6%
“Limited” named
Enthusiast
Q1. What brand/model was being advertised in the video? Base: Test respondents (n=250 per segment). Trim recall shows respondents who named the specific RAV4 edition they saw.
Detailed findings · Q2
Viewers consistently described the films as fresh, useful, lifestyle-relevant and more exciting than expected. The softest measure was “the video speaks to me personally” — identifying the clearest opportunity for the next round of creative development.
| Adventurer | Enthusiast | Explorer | |
|---|---|---|---|
| Makes the RAV4 feel more fun and exciting than expected | 78% | 72% | 78% |
| Feels fresh and original | 75% | 70% | 78% |
| Felt like useful information rather than advertising | 75% | 70% | 78% |
| Showed how the RAV4 can fit my lifestyle | 73% | 71% | 78% |
| Made me more likely to consider the RAV4 | 72% | 71% | 72% |
| Toyota understands Hispanic consumers like me | 69% | 69% | 72% |
| Increased my interest in learning more about the RAV4 | 71% | 68% | 71% |
| I would want to see more automotive videos like this | 68% | 68% | 72% |
| Showed Hispanic lifestyle in a way that felt real | 67% | 64% | 63% |
| The video speaks to me personally | 62% | 56% | 56% |
Q2. How well do each of the following describe this video? Top 2 Box (strongly + somewhat agree). Base: Test respondents (n=750 total). “Speaks to me personally” is the softest score everywhere — the clearest creative refinement opportunity.
We solved “fun.” The next frontier is “this is for me.”
Detailed findings · Q4
RAV4 was the only vehicle of the six tested to gain familiarity in all three segments. Nissan Rogue's familiarity fell 14 pts among Adventurers — the one clear case of the film displacing a specific competitor.
| Adventurer | Enthusiast | Explorer | |||||||
|---|---|---|---|---|---|---|---|---|---|
| Test | Ctrl | Diff | Test | Ctrl | Diff | Test | Ctrl | Diff | |
| Toyota RAV4 | 58% | 53% | +5 pts | 52% | 48% | +4 pts | 55% | 42% | +13 pts* |
| Honda CR-V | 48% | 51% | -3 pts | 46% | 46% | 0 | 43% | 42% | +1 pts |
| Nissan Rogue | 38% | 52% | -14 pts* | 38% | 39% | -1 pts | 41% | 39% | +2 pts |
| Kia Sportage | 34% | 35% | -1 pts | 36% | 33% | +3 pts | 31% | 24% | +7 pts |
| Hyundai Tucson | 36% | 39% | -3 pts | 30% | 31% | -1 pts | 33% | 30% | +3 pts |
| Chevrolet Equinox | 40% | 44% | -4 pts | 37% | 37% | 0 | 35% | 34% | +1 pts |
Q4. How familiar are you with each of these vehicles? Top 2 Box (know it very/fairly well). Base: n=250 test and n=250 control per segment. * = statistically significant at 95% confidence.
Detailed findings · Q6
RAV4 posted significant favorability lift among Adventurers (+12 pts) and Explorers (+9 pts). Against the same test/control framework, the competitive set moved downward on average, expanding RAV4's relative advantage — including among Enthusiasts, where RAV4's own score looked flat.
| Adventurer | Enthusiast | Explorer | |||||||
|---|---|---|---|---|---|---|---|---|---|
| Test | Ctrl | Diff | Test | Ctrl | Diff | Test | Ctrl | Diff | |
| Toyota RAV4 | 75% | 63% | +12 pts* | 67% | 66% | +1 pts | 69% | 60% | +9 pts* |
| Honda CR-V | 58% | 60% | -2 pts | 56% | 62% | -6 pts | 59% | 65% | -6 pts |
| Nissan Rogue | 44% | 51% | -7 pts | 39% | 56% | -17 pts* | 45% | 54% | -9 pts* |
| Kia Sportage | 44% | 50% | -6 pts | 39% | 47% | -8 pts | 38% | 44% | -6 pts |
| Hyundai Tucson | 41% | 47% | -6 pts | 34% | 46% | -12 pts* | 38% | 44% | -6 pts |
| Chevrolet Equinox | 42% | 45% | -3 pts | 36% | 47% | -11 pts* | 35% | 40% | -5 pts |
| Competitor average | 46% | 51% | -5 pts | 41% | 52% | -11 pts* | 43% | 49% | -6 pts |
| RAV4 net of competitor average | +17 pts | +12 pts | +15 pts | ||||||
Q6. What is your general opinion of each vehicle? Top 2 Box (very + somewhat favorable). Net row = RAV4's movement minus the average movement of the five competitor SUVs in the same cell.
Detailed findings · Q8
RAV4 consideration increased significantly among Explorers (+12 pts) and directionally among Adventurers, while competitor scores were lower in the test cells. The result was a double-digit relative advantage versus the competitor average across all three audiences.
| Adventurer | Enthusiast | Explorer | |||||||
|---|---|---|---|---|---|---|---|---|---|
| Test | Ctrl | Diff | Test | Ctrl | Diff | Test | Ctrl | Diff | |
| Toyota RAV4 | 80% | 76% | +4 pts | 76% | 75% | +1 pts | 80% | 68% | +12 pts* |
| Honda CR-V | 59% | 67% | -8 pts | 62% | 68% | -6 pts | 63% | 67% | -4 pts |
| Nissan Rogue | 47% | 62% | -15 pts* | 47% | 62% | -15 pts* | 50% | 62% | -12 pts* |
| Kia Sportage | 49% | 57% | -8 pts | 46% | 57% | -11 pts* | 46% | 51% | -5 pts |
| Hyundai Tucson | 49% | 56% | -7 pts | 43% | 53% | -10 pts | 47% | 50% | -3 pts |
| Chevrolet Equinox | 42% | 54% | -12 pts* | 44% | 49% | -5 pts | 41% | 46% | -5 pts |
| Competitor average | 49% | 59% | -10 pts | 48% | 58% | -9 pts | 49% | 55% | -6 pts |
| RAV4 net of competitor average | +14 pts | +10 pts | +18 pts | ||||||
Q8. If you were in the market for a new vehicle, how likely would you be to consider each one? Top 2 Box (very + somewhat likely). Net row = RAV4's movement minus the average movement of the five competitor SUVs in the same cell.
Detailed findings · Q9
This is where the brand-image shift became preference. Forced choice among six SUVs: exposure produced a highly significant shift in stated preference in all three segments, with the RAV4 taking roughly half of all picks.
| Adventurer | Enthusiast | Explorer | |||||||
|---|---|---|---|---|---|---|---|---|---|
| Test | Ctrl | Diff | Test | Ctrl | Diff | Test | Ctrl | Diff | |
| Toyota RAV4 | 53% | 32% | +21 pts* | 48% | 33% | +15 pts* | 52% | 27% | +25 pts* |
| Honda CR-V | 13% | 18% | -5 pts | 17% | 18% | -1 pts | 14% | 20% | -6 pts |
| Chevrolet Equinox | 10% | 16% | -6 pts | 11% | 14% | -3 pts | 10% | 14% | -4 pts |
| Kia Sportage | 12% | 12% | 0 | 8% | 14% | -6 pts | 10% | 16% | -6 pts |
| Nissan Rogue | 10% | 14% | -4 pts | 8% | 12% | -4 pts | 10% | 15% | -5 pts |
| Hyundai Tucson | 3% | 9% | -6 pts | 8% | 10% | -2 pts | 5% | 8% | -3 pts |
Q9. If you had to choose one of these vehicles for yourself, which one would it be? The Honda CR-V was a distant number two for all three segments.
The commercial implication
Exposure did not only improve attitudes toward RAV4. In all three audiences, it produced a statistically significant shift in stated vehicle preference.
What changed beyond choice
Toyota already owned trust and dependability. After exposure, “fun to drive,” “feels modern” and other emotional reasons became more prominent among RAV4 choosers.
That is how “Seriously Fun” begins solving the original “soulless” problem.
| Adventurer | Enthusiast | Explorer | |||||||
|---|---|---|---|---|---|---|---|---|---|
| Test | Ctrl | Diff | Test | Ctrl | Diff | Test | Ctrl | Diff | |
| I trust the brand | 52% | 58% | -6 pts | 60% | 73% | -13 pts* | 55% | 63% | -8 pts |
| It feels dependable | 47% | 49% | -2 pts | 47% | 55% | -8 pts | 52% | 62% | -10 pts |
| It has a good reputation | 46% | 51% | -5 pts | 46% | 57% | -11 pts | 47% | 62% | -15 pts* |
| It fits my lifestyle | 39% | 47% | -8 pts | 45% | 41% | +4 pts | 45% | 35% | +10 pts |
| It looks stylish | 44% | 39% | +5 pts | 42% | 37% | +5 pts | 41% | 38% | +3 pts |
| It feels modern | 42% | 35% | +7 pts | 43% | 37% | +6 pts | 39% | 26% | +13 pts |
| It seems fun to drive | 35% | 24% | +11 pts | 45% | 33% | +12 pts | 38% | 29% | +9 pts |
| It feels like a smart choice | 36% | 33% | +3 pts | 40% | 46% | -6 pts | 36% | 49% | -13 pts* |
| It is the right size for me | 37% | 35% | +2 pts | 42% | 44% | -2 pts | 32% | 47% | -15 pts* |
| It seems like the best value | 40% | 41% | -1 pts | 37% | 32% | +5 pts | 28% | 38% | -10 pts |
| It is the most visually appealing | 28% | 29% | -1 pts | 36% | 32% | +4 pts | 39% | 24% | +15 pts* |
| It seems good for recreational activities | 35% | 35% | 0 | 28% | 32% | -4 pts | 28% | 29% | -1 pts |
| It feels relevant to me | 28% | 29% | -1 pts | 25% | 23% | +2 pts | 30% | 21% | +9 pts |
| It is the vehicle I would most want to shop for | 25% | 25% | 0 | 20% | 26% | -6 pts | 24% | 26% | -2 pts |
| I or someone I know has owned one | 24% | 24% | 0 | 20% | 40% | -20 pts* | 22% | 18% | +4 pts |
Q9a. Why did you choose this vehicle? Base: respondents who picked the RAV4 (n=68–132 per cell). Declines on trust/dependability reflect a broader base of reasons being cited after exposure, not a loss of trust.
05 — The learning · Additional creative learning
Men responded more strongly on personal engagement and dealer-action intent. But women were essentially just as likely to consider and select the RAV4. The opportunity is therefore creative refinement, not a change in the underlying strategic territory.
Video perception (T2B)
Brand image (top box)
Action intent (very likely)
Outcome
Explorer segment only, “GR” film. Base: men n=101, women n=148. * = significantly higher than women at 95% confidence.
Next test
Can the performance-and-excitement territory preserve its strong outcome effect while increasing personal resonance among women?
Norms vs. results
Against its own control group, the study demonstrated significant movement across key brand and preference measures. Broader automotive norms provide additional directional context — not the basis of the conclusion.
RAV4 result (test vs. control)
+13 pts Explorer (sig.); +5 pts Adventurer, +4 pts Enthusiast
Directional norm
+3.1 pts — CINT general-market automotive digital benchmark (US, all formats, pulled July 2026; 191 studies)
Directional context
All three segments beat the general-market norm — Explorer by more than 4x. RAV4 was the only vehicle of the six tested to gain familiarity across all three segments.
RAV4 result (test vs. control)
+12 pts Adventurer, +9 pts Explorer (both sig.); +1 pt Enthusiast — the one segment below the norm on its own
Directional norm
+1.9 pts — CINT general-market automotive digital benchmark (138 studies)
Directional context
Two segments clear the norm by 5–6x. Enthusiast looks flat in absolute terms but nets to +12 pts relative lift once competitor decline is accounted for.
RAV4 result (test vs. control)
+12 pts Explorer (sig.); +4 pts Adventurer, +1 pt Enthusiast
Directional norm
+0.8 pts — CINT general-market automotive digital benchmark (173 studies)
Directional context
All three segments exceed the norm — Explorer by 15x. On net lift vs. the competitor average, all three show double-digit relative gains (+14 / +10 / +18 pts).
Benchmark context: The CINT benchmark is a general-market automotive digital norm (US, all formats, pulled July 2026). It is not audience-matched (this study targets Hispanic 25–44) or format-matched (branded content vs. CINT's broader digital mix), and CINT's norms reflect in-market exposure while the ThinkNow study used controlled exposure — so comparisons are directional context, not like-for-like normative testing. Results in this study are reported primarily as significant (95% CL) or directional against its own control group.
Source: CINT Automotive Digital Benchmarks, United States, all formats, pulled July 2026 (underlying studies per KPI: Familiarity 191, Opinion 138, Consideration 173).
FY27 RAV4 Launch RFP
The brief asked whether “Seriously Fun” could add emotion, relevance and desire to RAV4. The research shows where it worked — and what to improve next.
| Strategic objective | What the study proved | What it means |
|---|---|---|
| Increase familiarity | +13 pts among Explorers; positive lift across all three audiences. | Branded content can deepen RAV4 salience, not merely generate recall. |
| Improve opinion | +12 pts Adventurer and +9 pts Explorer favorability. | The strategy changed how people felt about the vehicle. |
| Make RAV4 feel fun | Significant lifts across Serious Fun, recreation, exploration, lifestyle fit and driving excitement. | The emotional repositioning worked. |
| Move consideration | +12 pts among Explorers; positive directional movement among Adventurers. | The perception shift traveled toward the purchase funnel. |
| Shift vehicle preference | +21 / +15 / +25 pts across Adventurer / Enthusiast / Explorer. | The strongest evidence that the strategy changed stated choice. |
| Connect with Hispanic consumers | ~70% felt Toyota understands Hispanic consumers like them; personal relevance was softer. | Cultural credibility is established. Personal specificity is the next creative opportunity. |
06 — The implication · What comes next
Lead with performance, excitement and exploration — the emotional territory that produced the strongest full-funnel expression of “Seriously Fun.”
Make the story feel more personally specific. “Speaks to me personally” was the softest response measure across the films.
Maintain strong Toyota/RAV4 attribution. Brand linkage was already 85–86% across audiences, with only 3–4% competitor confusion.
Connect future exposure to observed behavior — search, Toyota.com activity, lead generation, dealer engagement or CRM outcomes — so the next study can extend the story from stated intent to measurable action.
Future measurement recommendation · not a finding of this study
The takeaway
RAV4 already owned capability and dependability. This study shows that performance, exploration and excitement can add the missing emotional equity — while also increasing consideration and stated vehicle preference.
The campaign answered the brief. The research now makes the next brief smarter.
Methodology & sample
Hispanic automotive-specific norms don't exist to benchmark against, so results are reported as lifts: control vs. test. Lifts are flagged as significant (95% confidence), directional, or net/relative — RAV4's movement against the average movement of the five competitor SUVs in the same cell. Throughout this report, red marks a decline.
About the research partner
A multicultural-first, full-service research partner built to measure what general-market approaches often miss.
Unlike general-market firms, multicultural research is the core business — powered by a proprietary panel, culturally specialized researchers, bilingual moderators and decades of focused experience.
Designs, executes, analyzes and presents actionable insights end to end.
Brand Health, U&A, Campaign Measurement, Concept Testing and Trackers built specifically for multicultural and Hispanic audiences.
Advanced fraud detection, respondent validation, bot filtering and continuous quality controls ensure trustworthy results.
Clients work directly with experienced research professionals who design the study, oversee execution, analyze findings and present recommendations.
Every study includes strategic implications and clear recommendations tailored to the client's business objectives.